Data Center
Overview
Edge Xpert Manager provides a data center where you can query data readings and display read data in a line graph.
The Data Center page includes the following features:
- Query and Filter Data Readings
- Data Readings table
- Line Chart
View Data Center
To display the Data Center page, select DATA CENTER from the main menu.
Query Data Readings
To query the data readings, complete the following steps:
-
Select a Device, and select one or more device resources
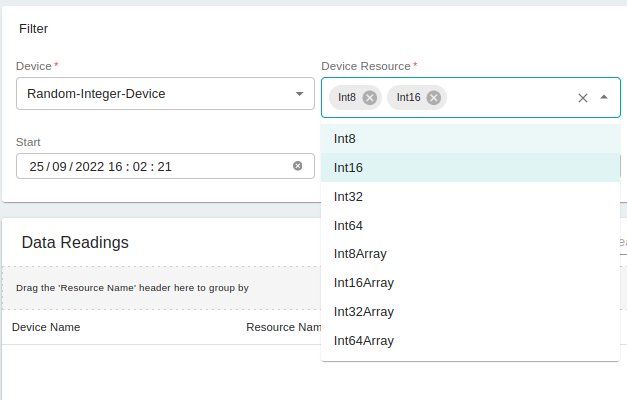
-
Chose the time range
-
Click the Query button
The matched data readings are listed, as illustrated below:
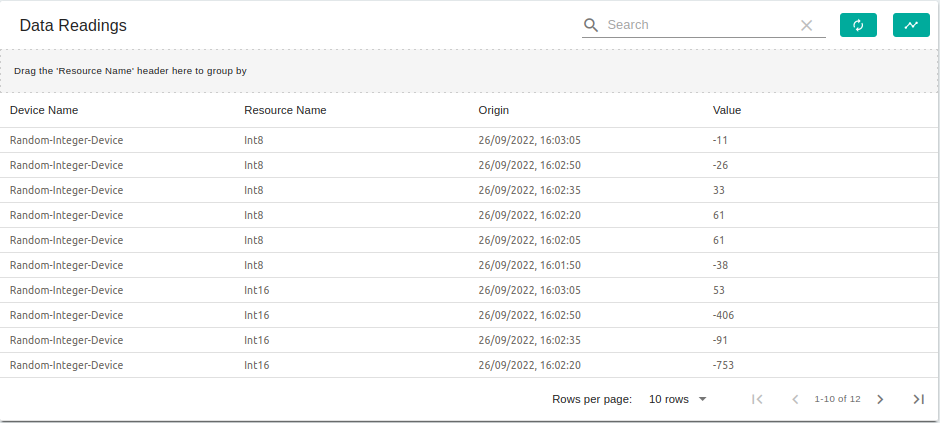
Either click the Query button again or click the
 button to refresh the query data readings.
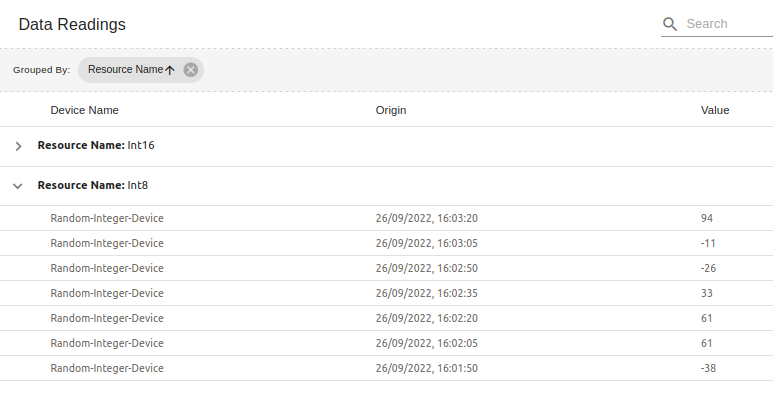
Group View of Data Readings Table
The Resource Name column of Data Readings table is draggable. Drag and place the Resource Name header in the indicated bar to see the data readings grouped by resource.
Line Chart of Data Readings
To view data readings as a line chart, click the  button.
Two line charts will be generated. An example can be seen below:
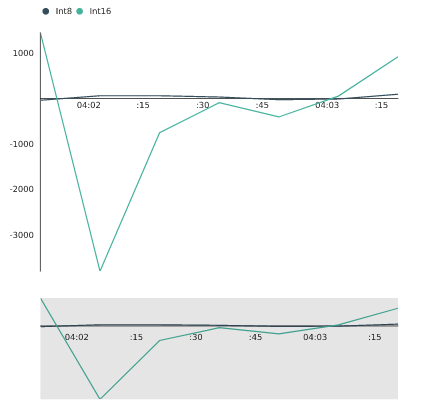
Hover over the larger chart to view a specific reading in further detail.
You can pull and drag the gray highlight on the smaller chart to easily scale the chart view and quickly look through the timeline.