Grafana
Grafana Overview
Grafana is an open-source visualization tool. It allows you to create dashboards for your data. Grafana can easily integrate with InfluxDB due to the provided datasource plug-in, which connects to and streams data from InfluxDB.
For further information on Grafana, refer to the Grafana documentation.
Grafana Example
This example demonstrates how to set up and use Grafana. Before using Grafana you need to set up Edge Xpert export data to InfluxDB. The steps for exporting data from the Virtual Device Service to InfluxDB are described in the InfluxDB example. Ensure you have completed this step before proceeding .
To visualize the readings in grafana, the following complete the following steps:
- Start Grafana
- Add a data source
- Create a dashboard
Start Grafana
Start Grafana using the following command:
edgexpert up grafana
Add a Data source
You need to add a datasource before using Grafana to visualize the data. The datasource will be the InfluxDB database where the Edge Xpert events are being sent.
To add a datasource, complete the following steps:
- Open a web browser.
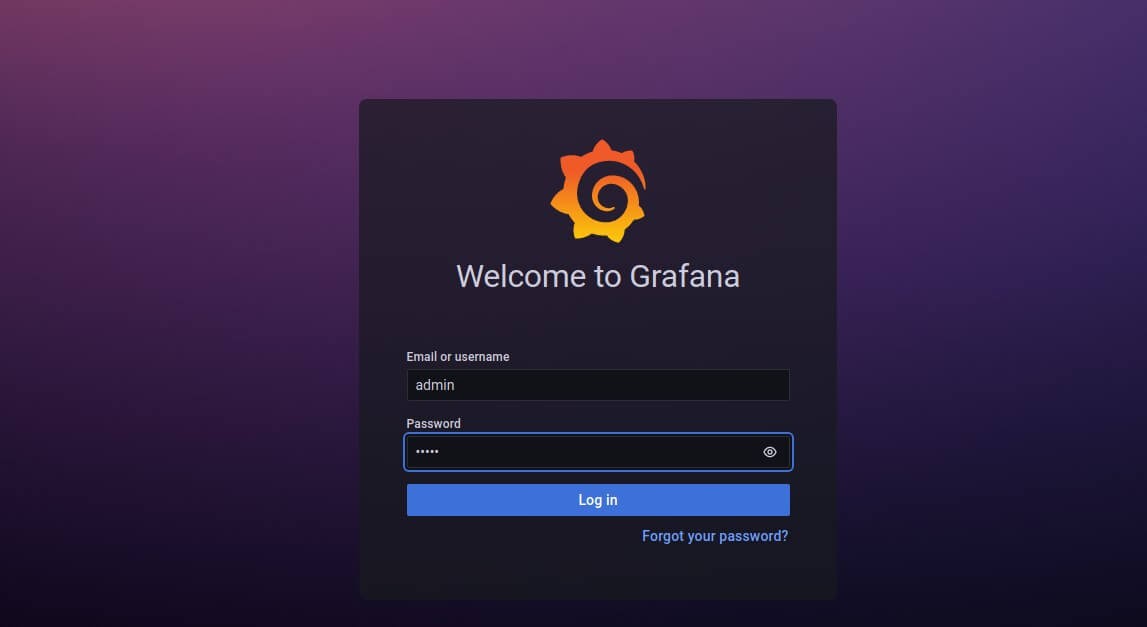
- In the Address Bar of your browser, enter
http://localhost:3000/login. In the login screen, enter admin as both username and password, as illustrated below:
Note
The port number can be configured in the docker-compose.yml file
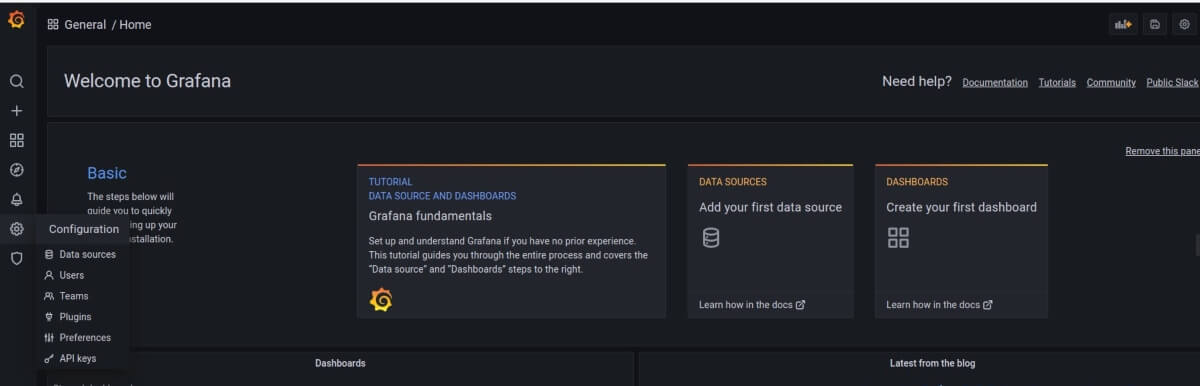
 3. Select Add Your First Data Source or Select Configuration > Data sources as illustrated below:
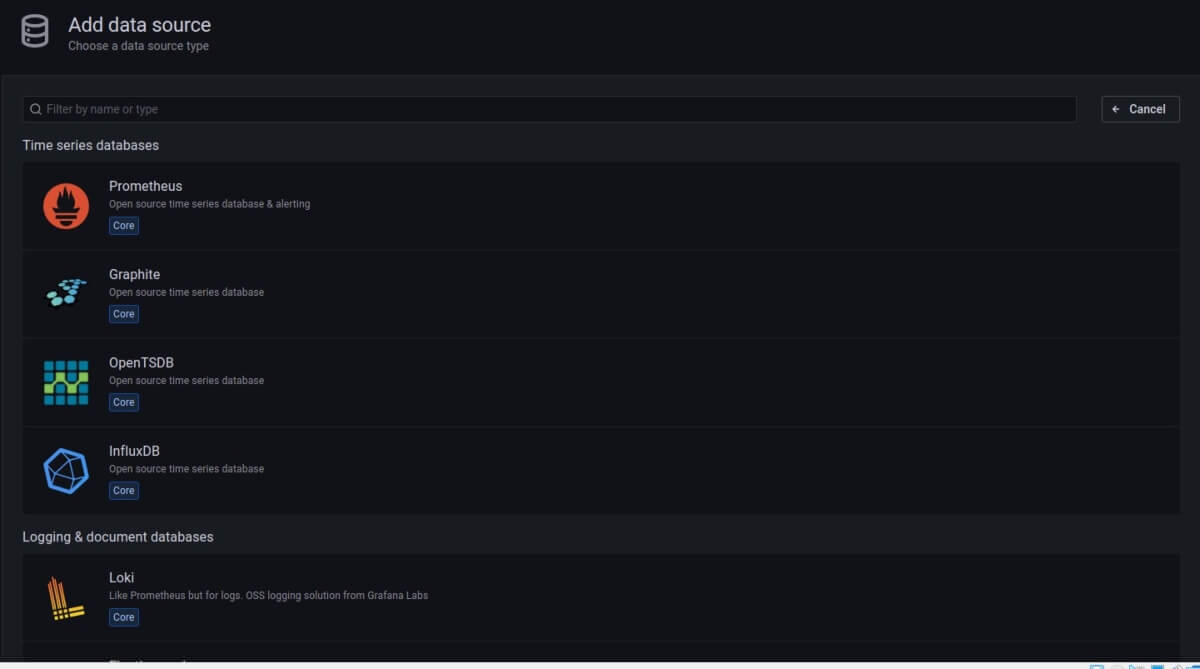
 4. Choose InfluxDB from the list of data sources
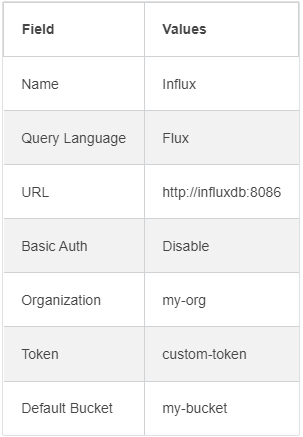
 5. Enter the information in the Add Data source screen.
Note
To set up the data source for this example, use the following values or your custom InfluxDB configurations.
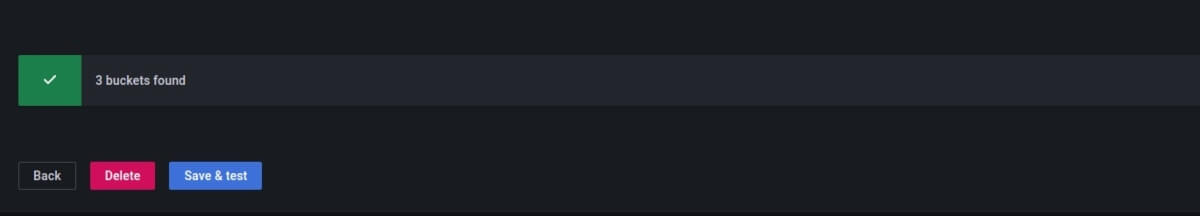
6. Click Save and Test and it should return buckets found, as illustrated below. If this message does not show up, double-check the entries in the fields and try again.
Create a Dashboard
To create a dashboard, complete the following steps:
- Select Create (+) > Dashboard
- On the Edit Panel page, choose InfluxDB as the data source
-
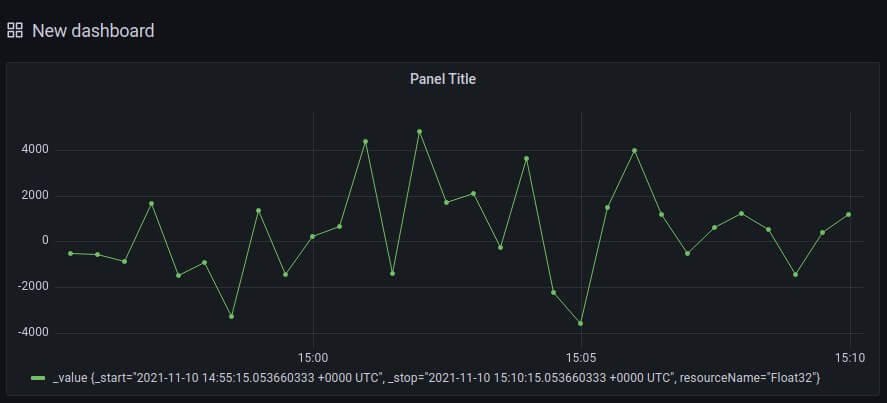
Enter the following script in the query script editor and click the apply button.
from(bucket: "my-bucket") |> range(start: -15m) |> filter(fn: (r) => r["_measurement"] == "readings" and r["resourceName"] == "Float32") |> group(columns: ["resourceName"]) |> sort(columns: ["_time"]) -
And you can see the same dashboard as illustrated below: