Dashboard
The landing page of Edge Xpert Manager provides a quick overview of the various Edge Xpert services on one page.
The dashboard is illustrated below:
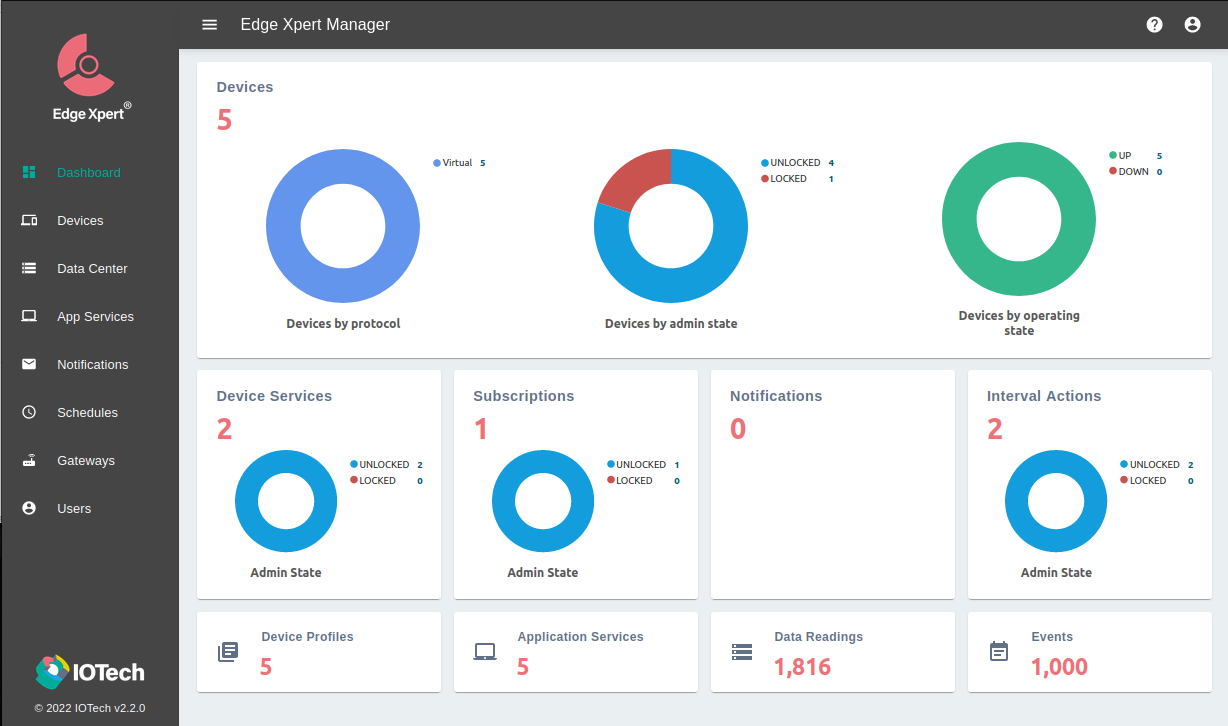
The dashboard displays various pie charts alongside the number of associated items. Details of these are described below:
-
Devices
- Devices by protocol. Displays a pie chart detailing the number of connected devices per Protocol
- Devices by admin state. Displays a pie chart detailing the number of connected devices per Admin State
- Devices by operating state. Displays a pie chart detailing the number of connected devices per Operating State
-
Device Services. Displays a pie chart detailing the number of connected device services, colored by Admin State
-
Subscriptions. Displays a pie chart detailing the number of subscriptions, colored by Admin State
-
Notifications. Displays a pie chart detailing the number of occurred notifications, colored by their Status
-
Interval Actions. Displays a pie chart detailing the number of set interval actions, colored by Admin State
The following data points display the total numbers of their respective items only:
- Device Profiles. Display the number of existing device profiles
- App Services. Display the number of existing Application Services
- Data readings. Display the number of readings for all devices
- Events. Display the number of events for all devices