Dashboarding with Grafana
Configure Grafana for edge visualization of the data. This can be done via Grafana's Web UI or via its REST APIs which could be invoked on the command line.
The tutorial project provides a pre-configured Grafana.json file that can simply be loaded into Grafana.
Grafana UI
-
In a web browser, navigate to http://localhost:3000
- Initial login is admin/admin
-
Create an InfluxDB Data Source
- Navigate to Data Sources within the Configuration panel (found in the left sidebar)
- Select Add Data Source and choose InfluxDB
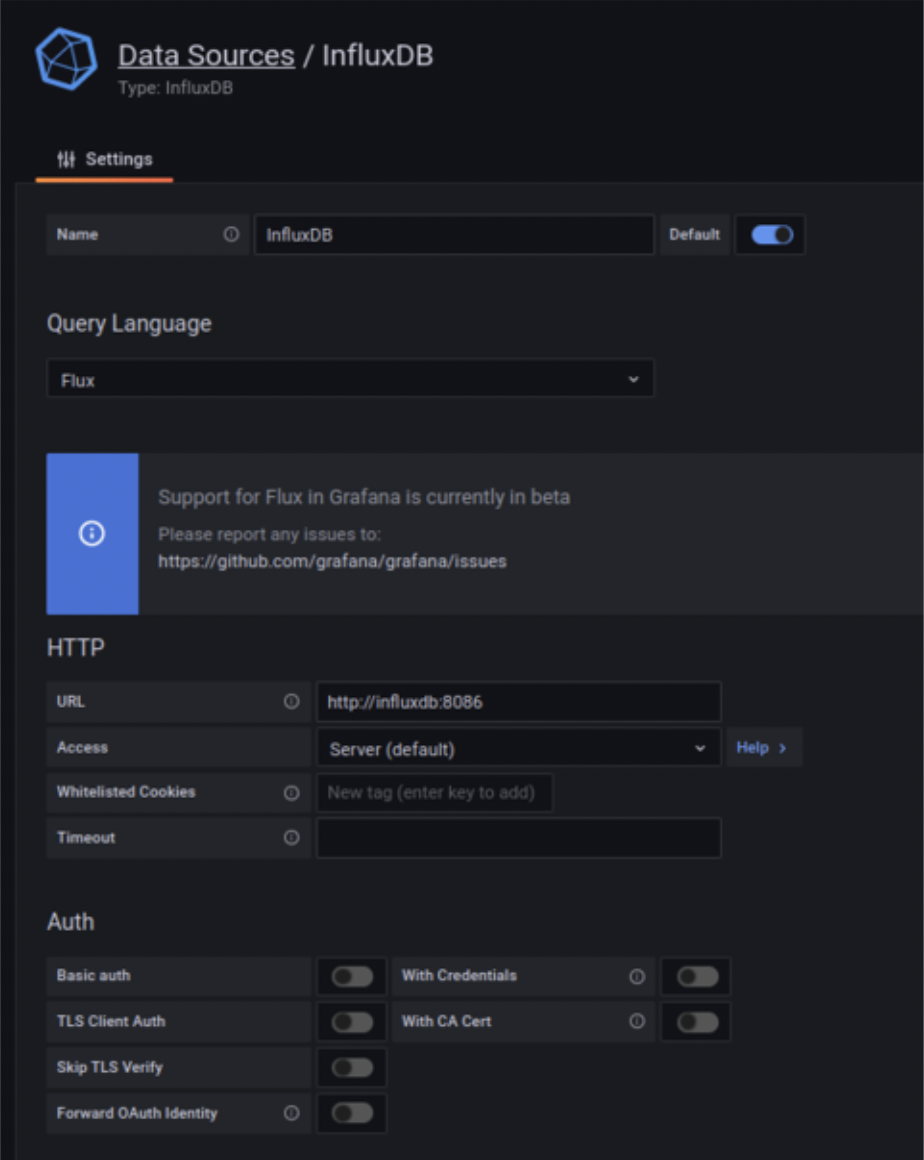
- Provision the data source with the following settings. Any fields not mentioned below should be left blank/default:
| Field | Value |
|---|---|
| Name | InfluxDB |
| Query Language | Flux |
| HTTP / URL | http://influxdb:8086 |
| Auth / Basic auth | Disabled |
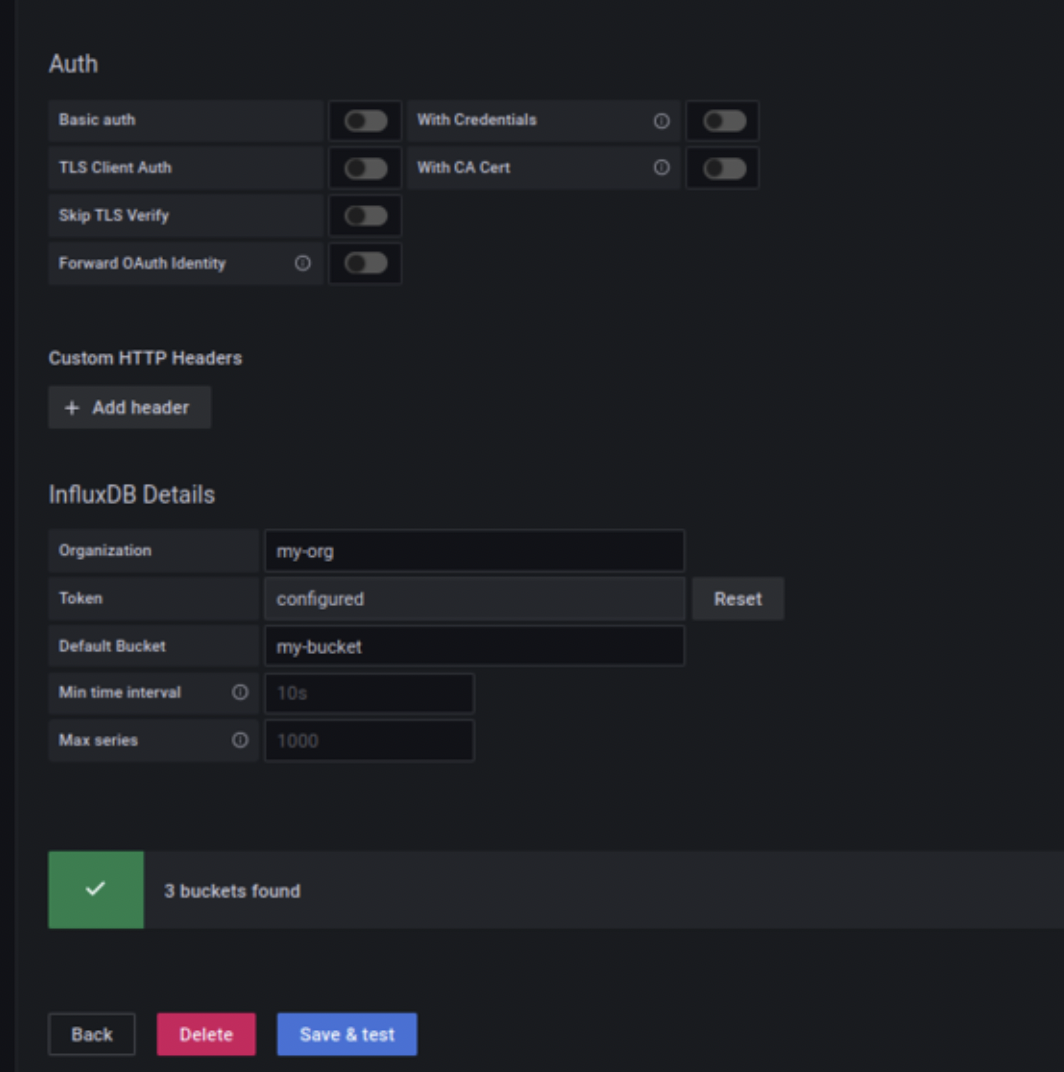
| InfluxDB Details / Organization | my-org |
| InfluxDB Details / Token | custom-token |
| InfluxDB Details / Default Bucket | my-bucket |
- Click Save & Test. A message saying "buckets found" should appear. See screenshots below:
-
Load and view the Grafana dashboard
- Select Create ("+") on the left sidebar and choose Import
- Select Upload JSON file and upload the Grafana.json file provided in the tutorial project
- Select Import
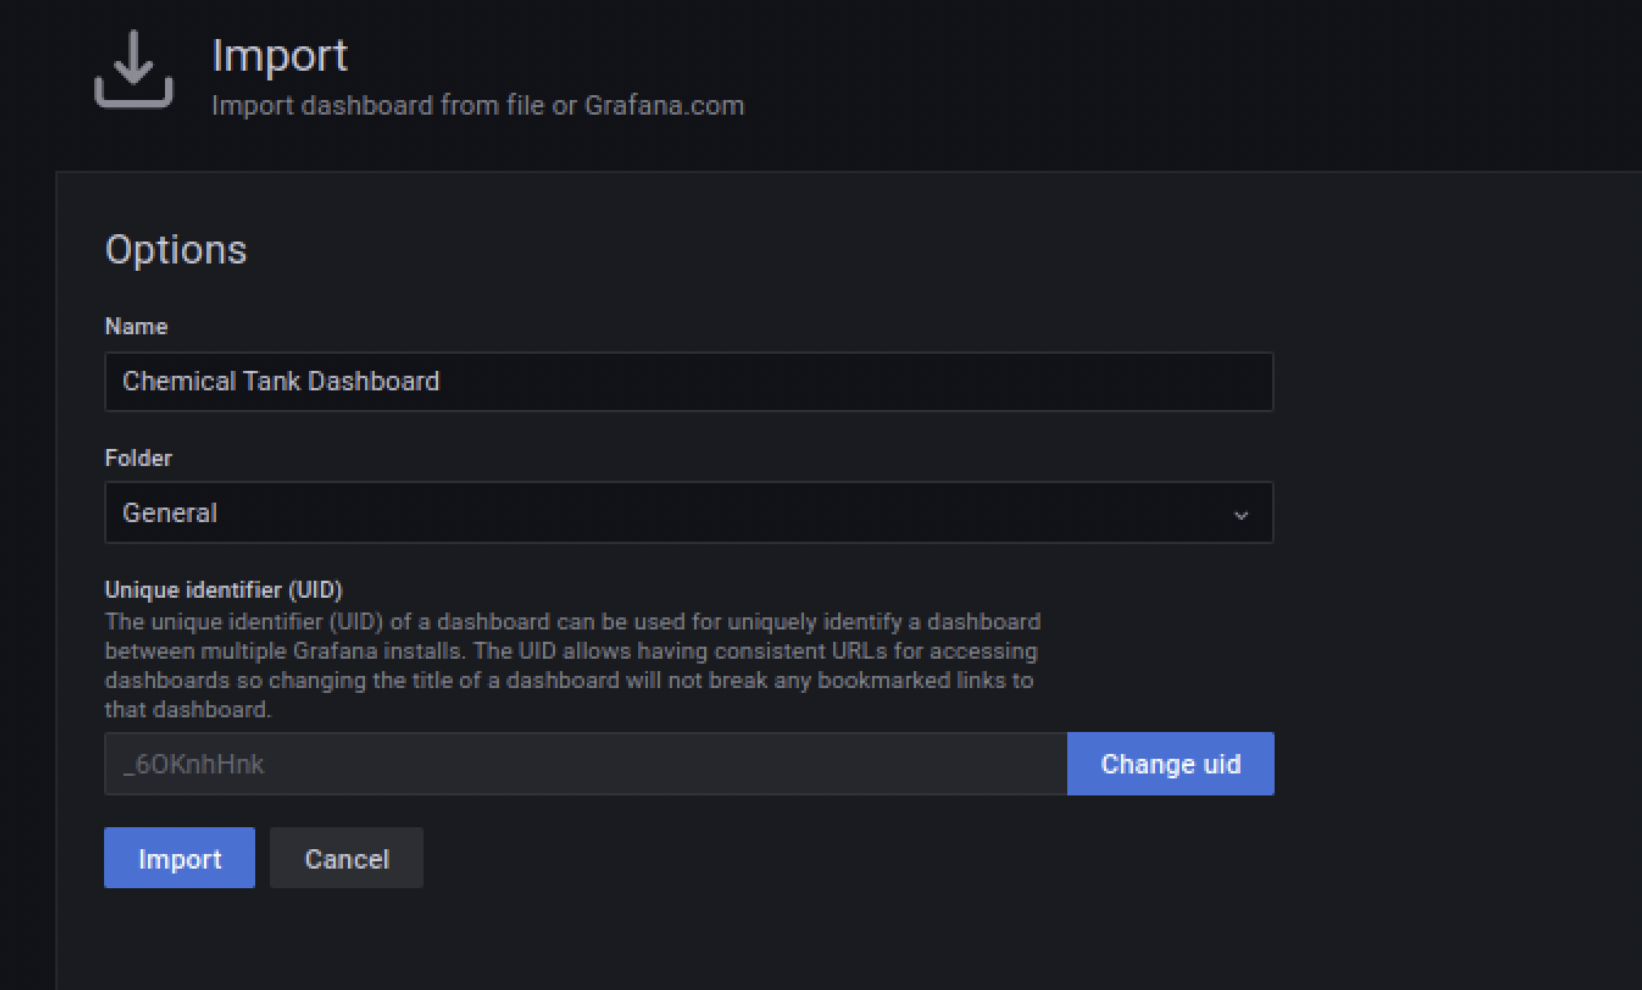
- The dashboard should look similar to as follows:
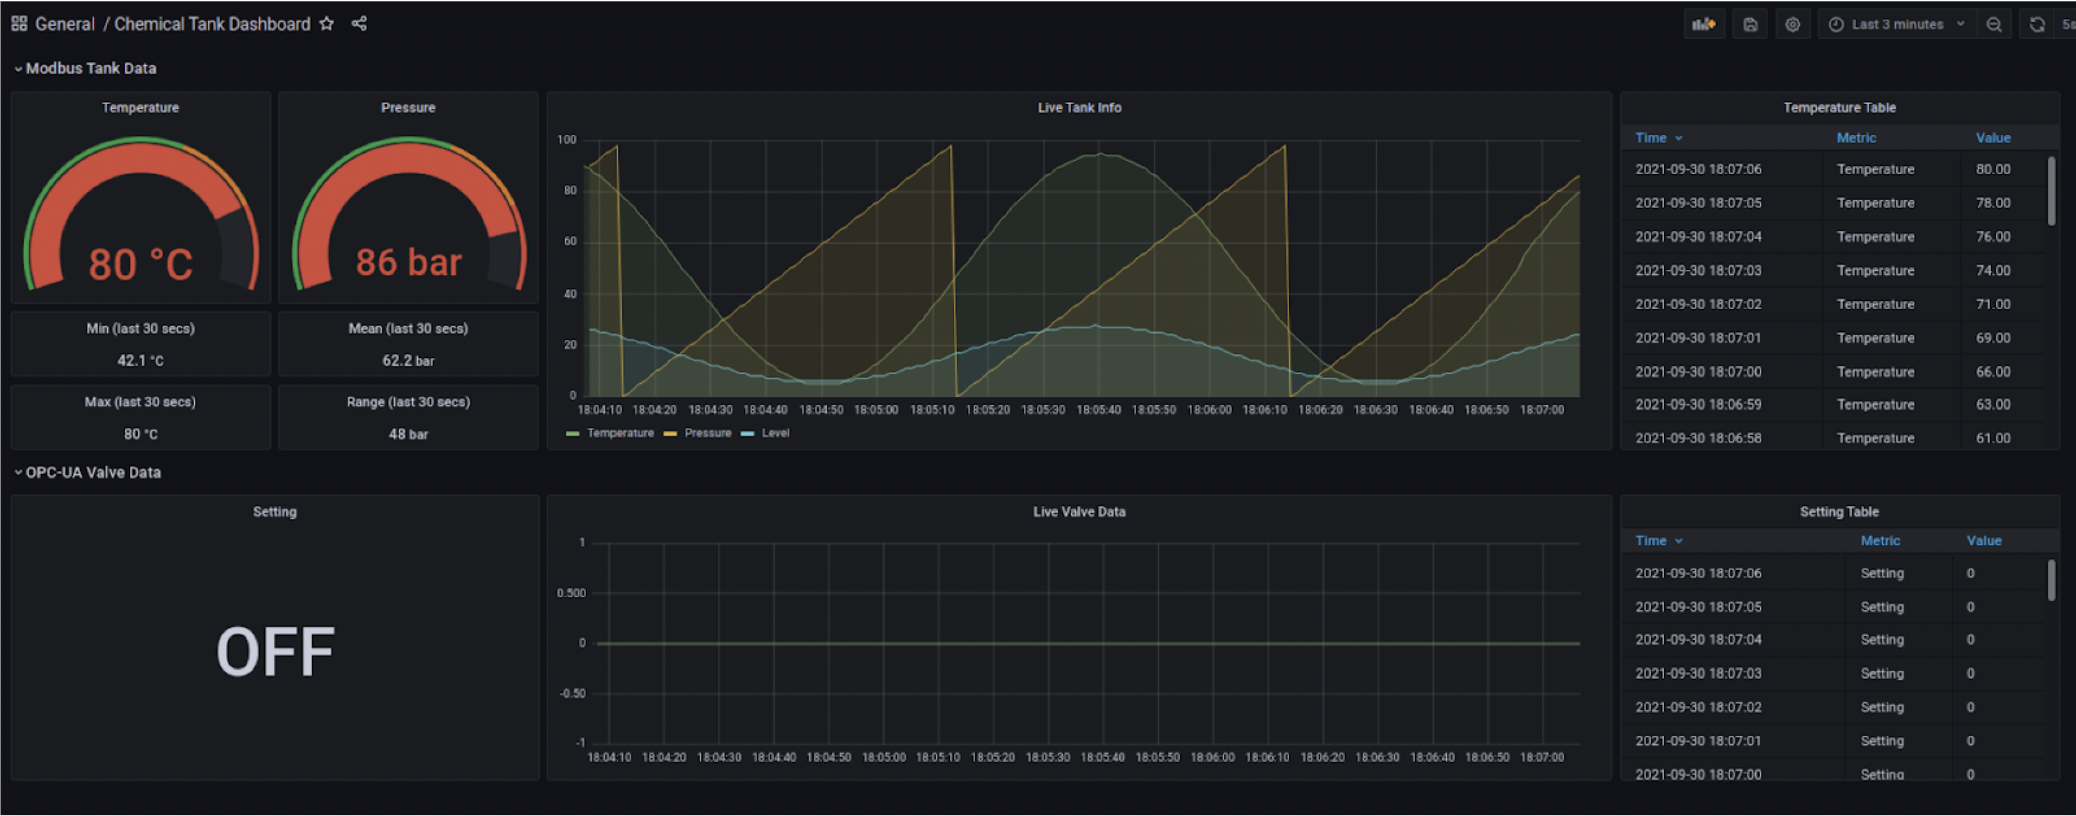
Note
You should see from the dashboard that the Setting value of the Outlet Valve is constantly 0 (OFF) and is not yet changing. We will enable the rules to automatically control the Outlet Valve in the Edge Rules step
Grafana REST Commands
As an alternative to using the Grafana UI, Grafana can be configured via its REST APIs as follows:
-
Configure the InfluxDB data source:
curl http://admin:admin@localhost:3000/api/datasources -H "Content-Type:application/json" -X POST \ -d '{ "name": "InfluxDB", "type": "influxdb", "url": "http://influxdb:8086", "access":"proxy", "basicAuth":false, "jsonData": { "organization": "my-org", "defaultBucket": "my-bucket", "version": "Flux" }, "secureJsonData": { "token": "custom-token" } } }' -
Load the tutorial-provided Grafana.json dashboard configuration:
curl http://admin:admin@localhost:3000/api/dashboards/db -H "Content-Type:application/json" -X POST \ -d '{ "dashboard":'"$(cat Grafana.json | tr -d '\t\n\r ')"' }' -
In a web browser, navigate to http://localhost:3000
- Initial login is admin/admin
- View the loaded dashboard at Dashboards / Browse / ChemicalTankDashboard which, once loaded, should look the same as the screenshot above